
The Veil of Uncertainty
As a wealth management firm, we send out quarterly market reviews and performance reports to our clients. My greatest fear with these reviews though, a fear I’ll likely return to over the years, is the possibility they become information without context.
If you think about the way we get a lot of information today, it’s often a series of reported events without context. There is very little time given to grounding the audience in what has happened in the past, progress made relative to the past, or the range of outcomes we should naturally expect. A market decline, for example, looks very different when presented as an isolated crisis rather than something investors should reasonably expect to experience over their lifetimes.
That’s why, in addition to the market reporting we release, I like to add my own thoughts on how we should interpret events through the lens of our investment and planning philosophy. Markets are remarkable wealth creators, but their day-to-day fluctuations are only one part of our financial journey. When we look beyond those fluctuations, a field of opportunity opens, along with uncertainties we cannot fully predict.
In the latter half of the 20th century, philosopher John Rawls introduced the idea of the “veil of ignorance.” In his thought experiment, Rawls challenged people to reflect on the type of society they’d want if they didn’t know what position they would hold within it. Financial planning, by contrast, happens under a veil of uncertainty rather than ignorance. In this context, we know the risks that exist, but we're uncertain about how often they’ll occur or their magnitude. Ignorance, on the other hand, means not knowing about the risks at all. If your financial advisor is unaware of a risk to your financial well-being, you may need a new advisor.
One of the best ways to understand the risks veiled by uncertainty is to look at a map. Figure 1 shows the gradual shift from human capital to financial capital throughout our lifetime. When we are young, we have lots of human capital that we trade for income to live on. Some of that income is invested in financial capital such as stocks. This financial capital continues to accumulate and compound until we retire and start turning it back into income to live on.
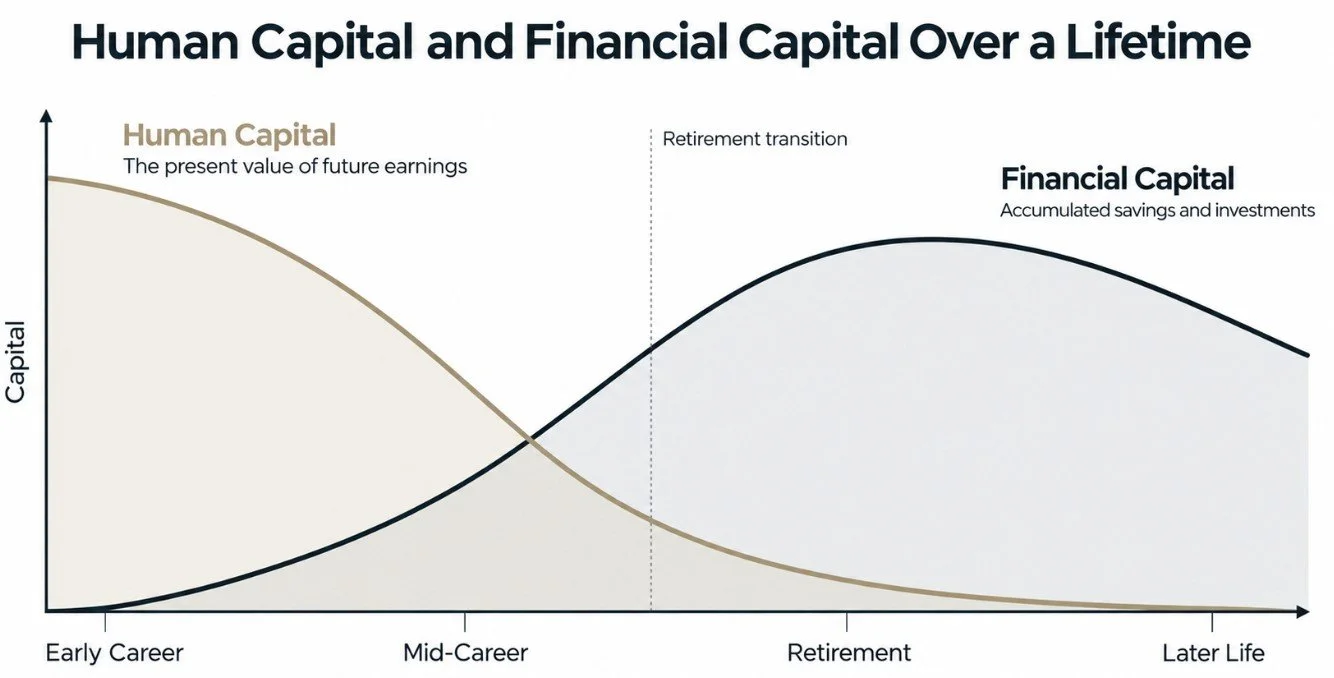
Now, what risks will we encounter on this journey? I’d define “risk” not as market risk, but instead anything that permanently impedes the accumulation of financial capital or rapidly depletes it.
From this point of view, the fluctuations we see in a diversified portfolio are often akin to turbulence on an airplane, uncomfortable but manageable when we've prepared for the journey. The real risks to our financial journey are the mistakes we make and the unexpected life events we're unprepared to navigate.
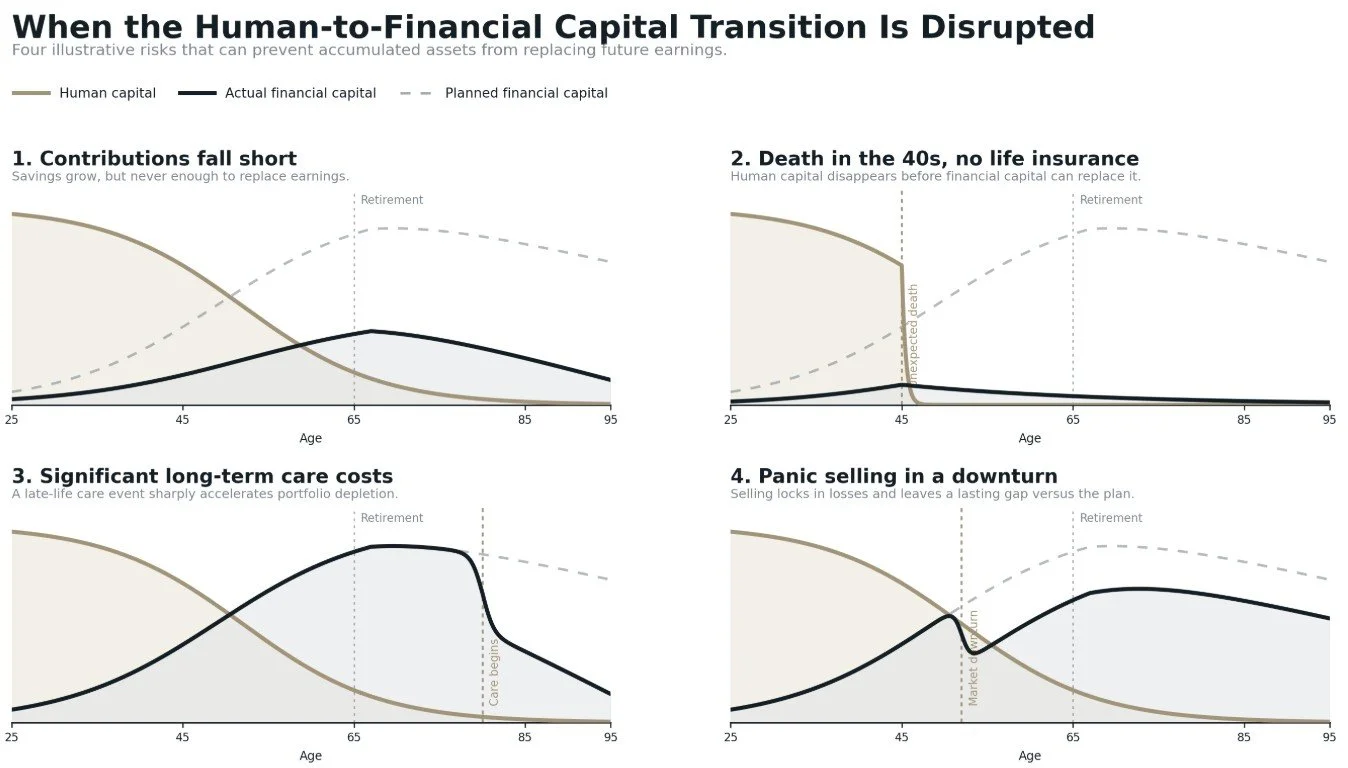
Let’s look at Figure 2 to review some of the errors and unfortunate events that can harm our financial plan and fellow passengers.
For those planning for retirement One risk is failing to contribute enough to our investment accounts to achieve or maintain the quality of life we envision once we leave the workforce. Another is passing away before saving enough to provide for one’s family.
For those already retired, the risks may look like unexpected long-term care costs or panic selling during a market downturn.
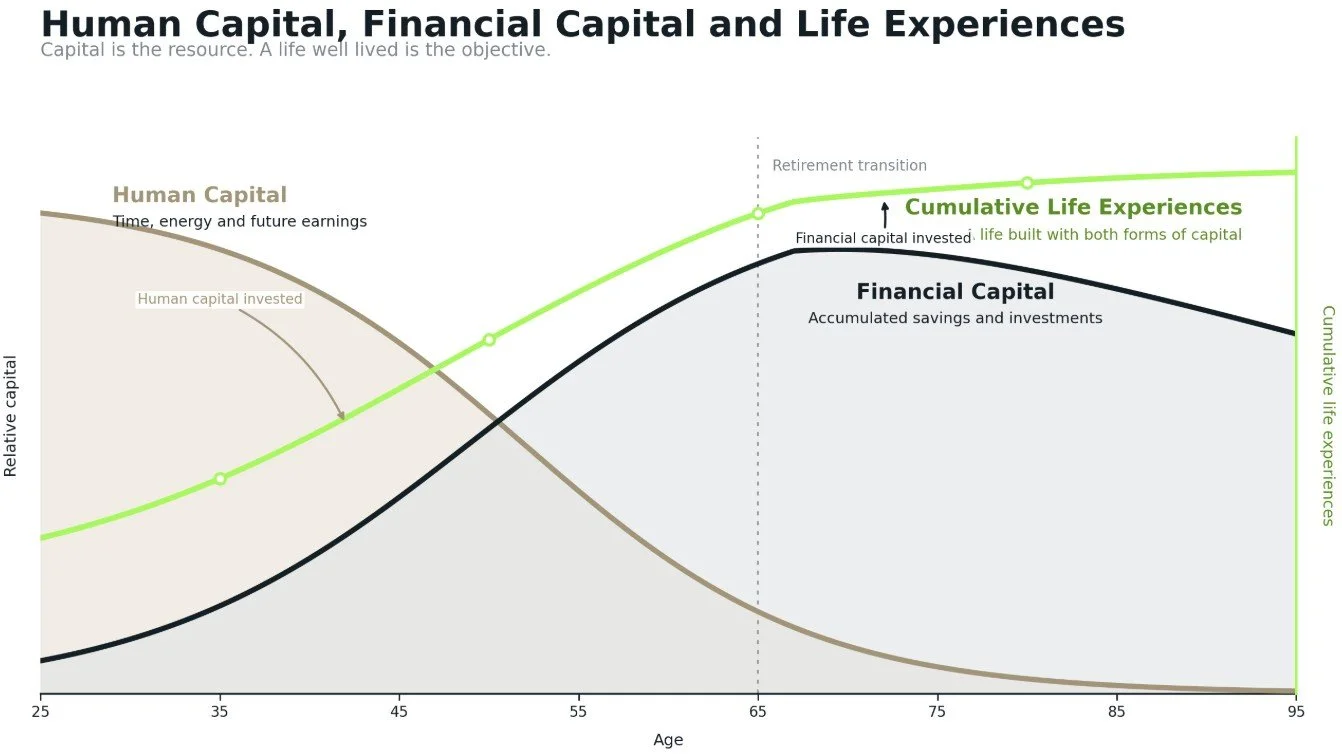
So far, I’ve written about the veil of uncertainty as a risk that needs to be managed. However, I also think the veil can serve as a motivator in our financial journey. As Figure 3 depicts, knowing there is risk beyond the turbulence in our portfolios should encourage us to use our human and financial capital across our lifetime to invest in the life experiences that bring meaning to us. It dares us to ask whether we're spending our working years accumulating things instead of memories. Or in retirement, refusing to spend our financial capital on the trips that bring us joy. Like the White Queen in Through the Looking-Glass, is it always jam tomorrow and never today?
When reading through a quarterly market review, you may focus on how your portfolio fluctuates with world events and Treasury yields. However, I hope these various maps illustrate that some of life's greatest risks have little to do with market performance at all. They're the financial uncertainties we cannot predict and the meaningful experiences we continually postpone. A thoughtful financial plan prepares us for the former while giving us the freedom to pursue the latter. Ultimately, it should encourage us to live boldly and experience what truly matters.
To read the rest of the Quarterly Market Review and my colleague’s summary of Q3 2026, click here.